Text Analytics
Text Data and Applications
Text Analytics:
- Clustering(聚类)
- Grouping documents based on their hidden topics
- Classification(分类)
- Spam email detection based on email content\
- Sentiment analysis
- It extracts social sentiment from a document (positive, negative, neutral)
Characteristics of Text Data
- Different types: characters, numbers, punctuations
- High-fequency words: a, the, in. To, is
- Different forms of words
Feature Extraction (特征提取)
Feature extraction on text data: The process of transforming raw data into numerical features that can be processed while preserving the information in the orginal data set
After Feature Extraction: feed the extracted features into data analytical methods
Tokenization(标记化/词汇切分): 1, convert the text into a sequence of tokens(words/terms) 2, Observation meaningless or meaningful
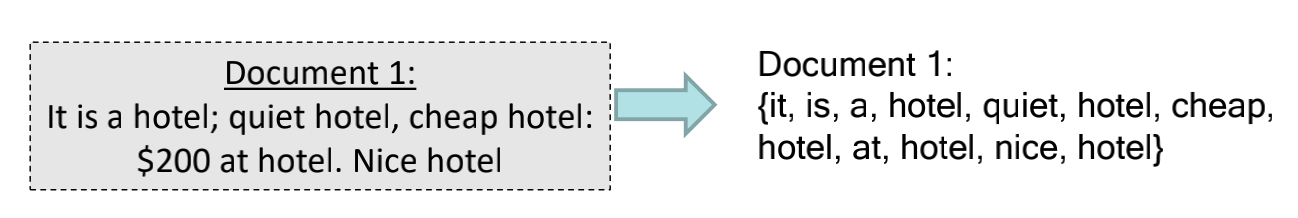
- Simple approach: 1,split by spaces. 2, ignore all numbers and punctuation 3, use case-insensitive strings as tokens(空格分隔、不区分标点、不区分大小写)
- Stopwords: function words: a, the, in, to. Pronouns I, he, she, it
- Stemming: For matching purpose, convert keywords in the documents to their stems(base word forms)(将词汇转换为基本词干)
- Poter Stemmer : procedure for removing known prefixes/suffixes(删除单词前后缀)
- For example computer, computational, computation… ->comput
- Side effects: may produce stems that are not words, or different meaning from the original word;(organization ->organ)
- (补充:English: NLTK, SpaCy, Stanford…中文:THULAC, FoolNLTK, HanLP, Ictclas, HIT…)
Text Corpus and Vocabulary
- Text corpus: the set of texts used for the task(该任务的语料库), The set of unique words is referred to as the vocabulary.
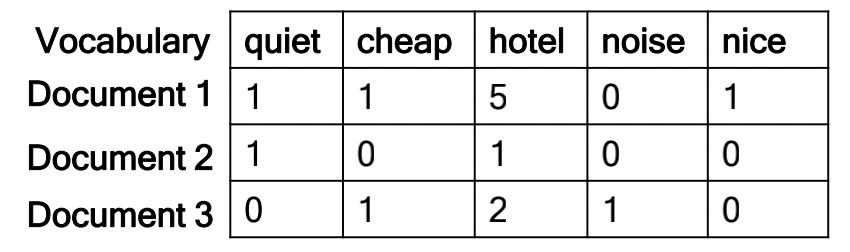
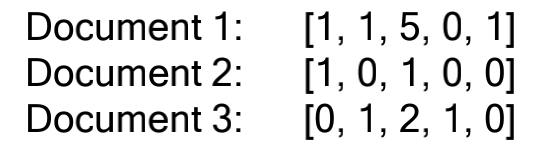
Bag of Words Model
Convert each document to a bag(multiset) of words/terms. A bag allows multiple occurrence of a term.
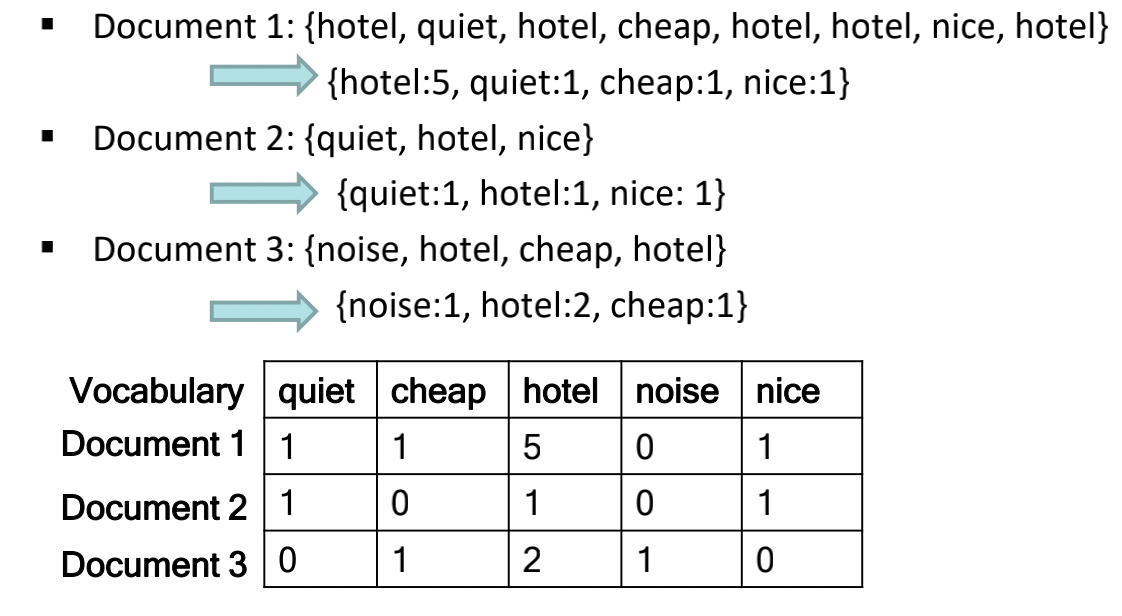
Bags(Multiset) of words with Term Frequence.
Bag-of-words Model is one Example of Vector Space Model
- After feature extraction,We convert each document to a vector, convert the text corpus to a matrix.(文档转换为向量,语料库转换为矩阵)
Vector space Model
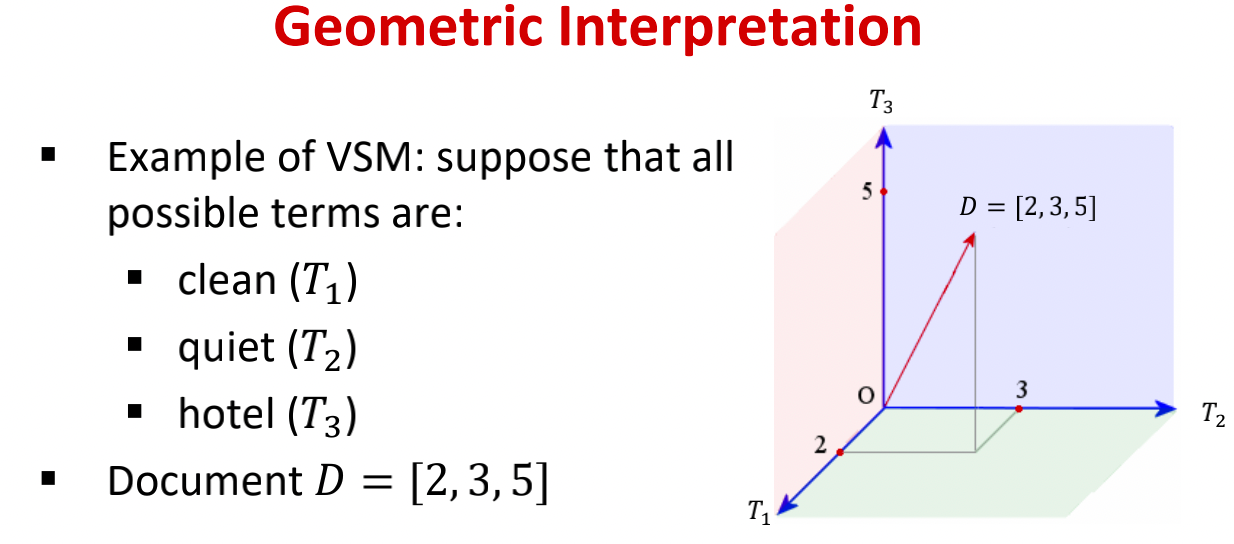
- The vector space model is defined by basis vectors.(向量空间由基向量所定义)
- Each term in vocabulary defines a basis vector $T_i$.(每个术语定义了一个基向量)
- Each basis vector is orthogonal to each other.(每个基向量彼此正交)
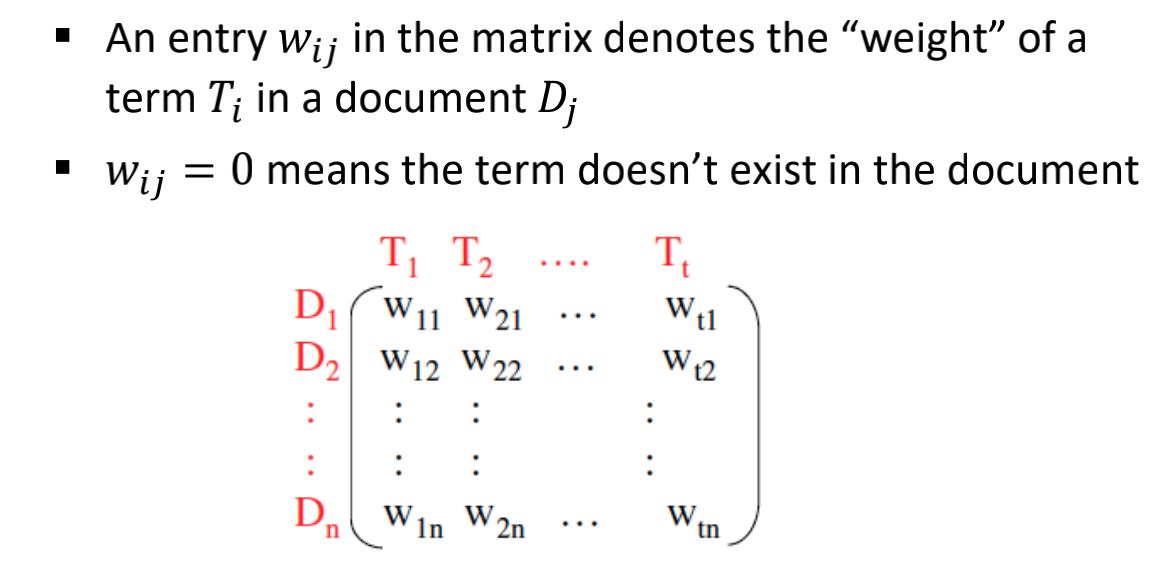
- Document $D_j$ As T-dimensional vector
- t is the size of vocabulary.(t是预处理后保留的术语的数量)
- $D_j$ = ($w_1j$ , $w_2j$ , $w_3j$ , … $w_tj$ , )
- $w_ij$ denotes the weight of term $T_i$ in a document $D_j$.
Similarity Search
Cosine Similarity
With respect to query text: {cheap, quiet, nice, hotel}
- Convert query text to query vector [1, 1, 1, 0, 1]
-
We need a similarity measure between query and documents
[1, 1, 1, 0, 1]
Inner Product: 𝐪 ⋅ $𝐱 = 𝑥_1𝑞_1 + ⋯ + 𝑥_𝑛𝑞_𝑛 $
The magnitude/length of a n-dimensional vector $x = [x_1, x_2,…,x_n]$ \(||x||=\sqrt[]{x_1^2+...x_n^2}\) Cosine similarity measures the cosine of the angle between vectors(余弦相似度:向量之间的夹角余弦) \(CosSim(q,x)=q\cdot x \over ||q||\ |x||\) Inner Product and Cosine Similarity
-
Both are defined in the inner product space
-
Cosine similarity only cares about angle difference(余弦相似度只关心角度)
-
Inner product cares about angle and magnitude(内积关注角度和大小)
TF-IDF
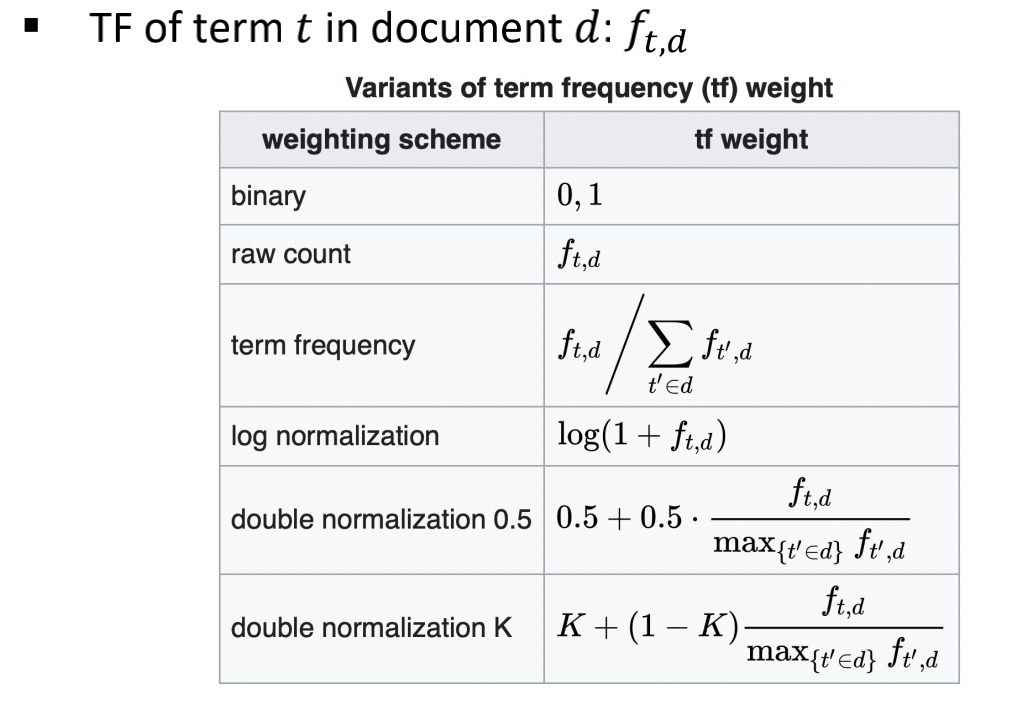
TF-IDF: Determine the importance of a Word, Term Frequency.
-
More frequent terms in a document are more important. $tf_{ij} = frequency\ of\ term\ i\ in \ document \ j$
-
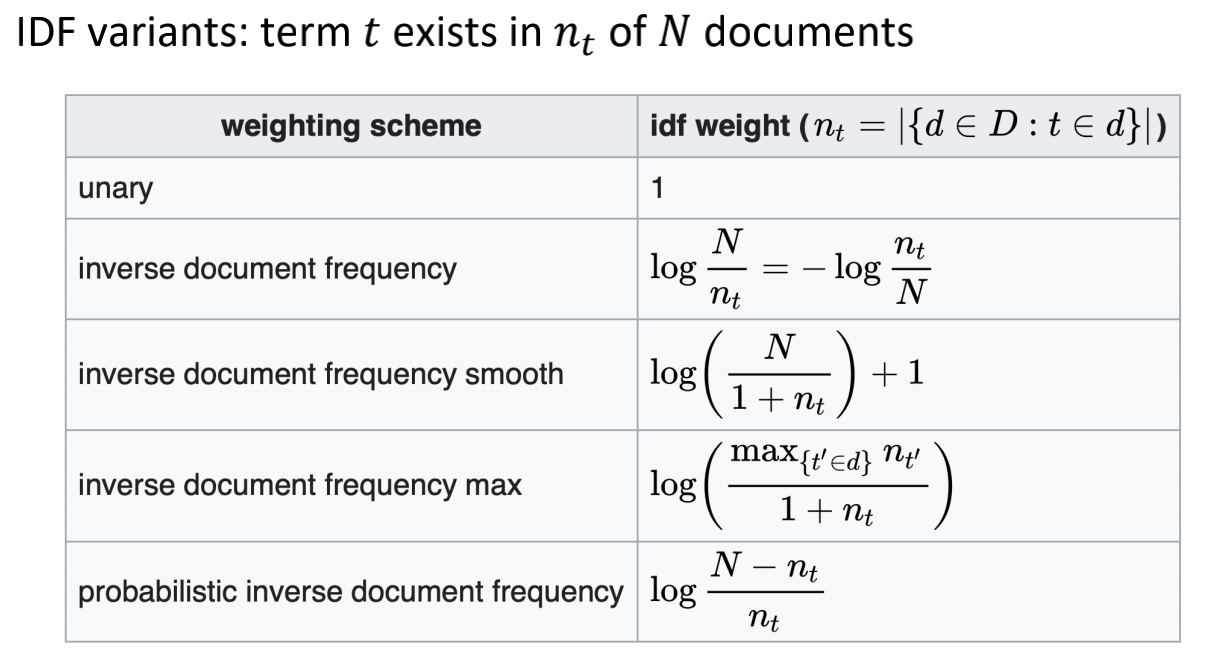
Inverse ducument frequency IDF
Terms that appear in many different documents are less indicative of overall topic in a document.
$𝑑𝑓_𝑖$ = number of documents containing term 𝑖
$𝑖𝑑𝑓_𝑖$ = inverse document frequency of term 𝑖
= $log_2(\cfrac N{df_i})$
TF-IDF weighting: The combined term importance indicator is called tf-idf weighting: $w_{ij}=tf_{ij}\cdot idf_i$
- A term has high weight when: it occurs frequently in the document, but rarely in the rest of the collection.
==Exercise slide53==
Unsupervised Algorithms
Clustering
Applications and Concepts
Clustering is the task of grouping a set of objects in such a way that objects in the same group are more similar(similarity measures相似度度量) to each other than to those in other groups(clusters).将对象进行分组,使同一组对象中的相似程度比其他组更高
Clustering is used:
- As a stand-tool to get insight inito data distribution.(集群可视化)
- As a preprocessing step for other algorithms.(数据清洗和压缩)
Outlier Analysis by clustering
- Outliers are objects that do not belong to any cluster or form clusters of very small cardinality
- Distances on numerical values
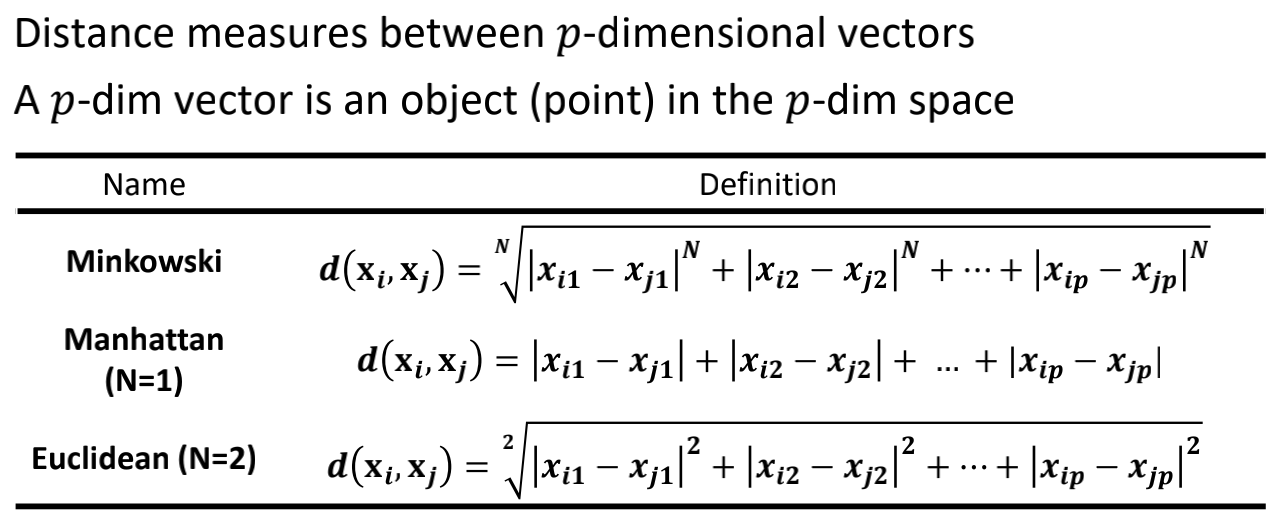
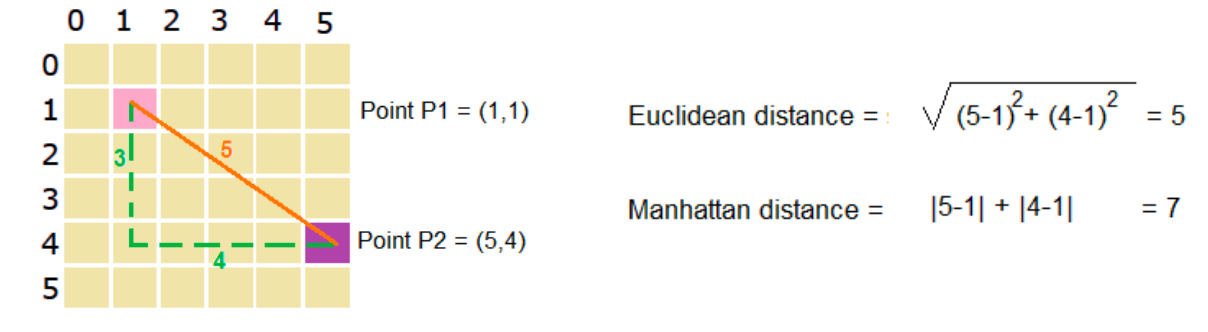
Euclidean distance:欧氏距 \(d(x_i, x_j)= \sqrt[2]{|x_{i1}-x_{j1}|^2+|x_{i2}-x_{j2}|+...+|x_{ip}-x_{jp}|^2}\)
- $d(x_i, x_j)\ge0$ (non-negativity)
- $d(x_i, x_j)=0$ (coincidence) 契合
- $d(x_i, x_j)=d(x_j, x_i)$ (symmetry) 对称
- $d(x_i, x_j)\le d(x_i, x_k)+d(x_k, x_j)$ (triangular inequality)三角不等式
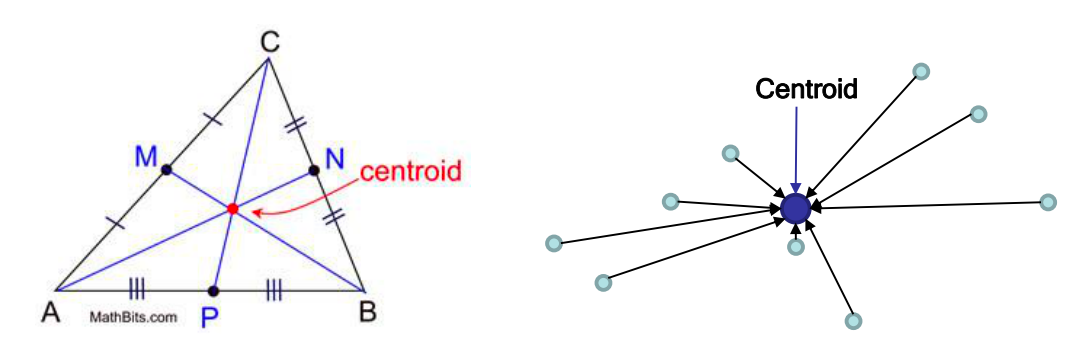
Also one can use weighted distance \(d(x_i, x_j)= \sqrt[2]{w_1|x_{i1}-x_{j1}|^2+w_2|x_{i2}-x_{j2}|+...+w_p|x_{ip}-x_{jp}|^2}\) The centroid or geometric center of a plane figure is the arthmetic mean position of all the points in the shape.平面图形的质心/几何中心是该形状所有点坐标算术平均值位置
K-Means
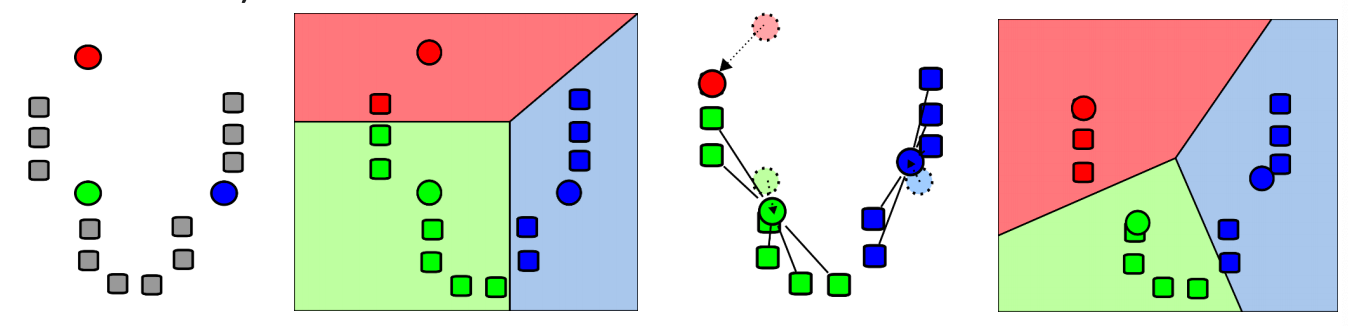
Partitioning method划分方法:Construct a partition of a database D of objects into a set of k clusters.将数据库D中的N个对象划分为k个集群
- Each cluster is represented by the center of the cluster.
- k initial random centroids in the data domain. 初始数据域中的随机质心
- Assign objects to nearest centroid to from clusters.
- Update centroids by conputing the mean ofa each cluster.通过计算每个簇的平均值计算质心
- go to step 2
Pseudo-code
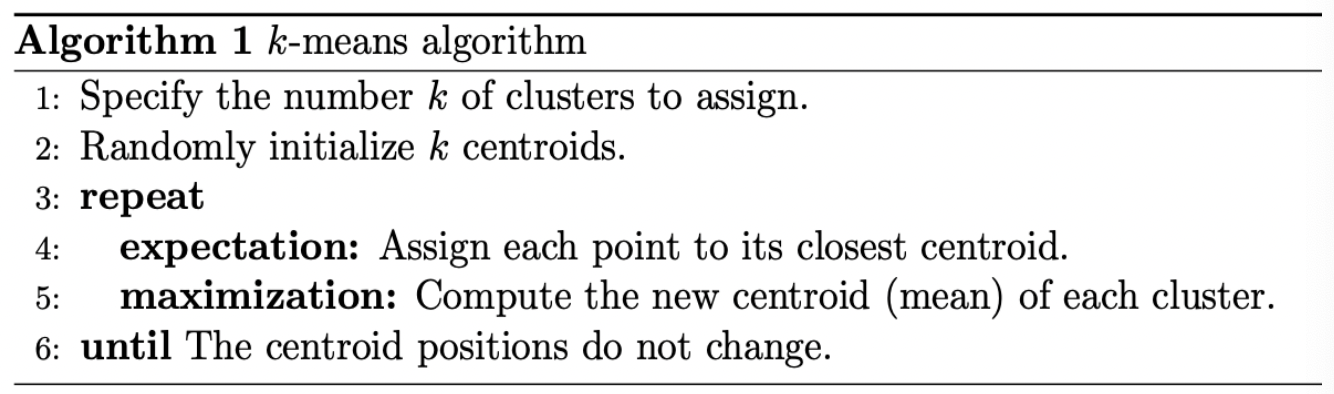
Strength: Relatively efficient: O(tkn), wheren is # objects, k is $cluster, and t is #iteration.(对象数量,簇数量, 迭代次数) Normallymk,t«n
Weakness:
-
Applicable only when mean is defined (what about categorical data)?仅在平均数据有效时有用
-
Need to specify k, the number of clusters, in advance需要制定簇的数量
-
Unable to handle noisy data and outliers.无法处理噪声和异常值
-
Not suitable to discover clusters with non-convex shapes.不能判断非凸簇
Distance between clusters
- Single Link: smallest distance between any points in two clusters
- Complete Link: largest distance between any points in two clusters
- Centroid: distance between the centroids of two clusters
- Average Link: average distance of all pairwise points in clusters
- Average of the distances of the 4*3 pairs of points in the example